BSC develops new tools to provide tailored climate forecast information and indicators
Researchers and research engineers of the Earth System Services (ESS) and the Computational Earth Sciences (CES) groups at BSC have developed a series of software packages that provides climate forecast information and climate indicators for sectorial applications.
The urgent need for robust climate change adaptation and mitigation strategies, including improving climate risk management, has triggered the development of climate services in recent years. Climate service products must be customised based on the available scientific knowledge and user-specific information needs. Choosing the appropriate data sources (such as climate observations, forecasts, and projections), the most suitable tools, and appealing visualisations is key to tailoring climate products to each sectoral application.
While several initiatives grant data access, their availability does not automatically imply having access to helpful climate information. Post-processing methods with different levels of sophistication are required to convert climate data into helpful climate information. Indeed, researchers and climate services providers have developed methodologies to fulfil most of the needs. However, these methodologies are scattered in the scientific community and are usually devoted to specific analyses. Strategic and consistent development of climate services tools is, thus, a fundamental need to profit from the scientific knowledge and the number of available datasets.
When providing climate services based on climate forecasts at sub-seasonal, seasonal, and decadal time scales, the bias adjustment of those simulations is crucial to provide reliable services. Providing climate indicators can complement the post-processing of these types of forecasts. A climate indicator is an aggregation or combination of climatic variable(s) that captures climate change and variability or its impact on a specific application. Climate indicators can help to anticipate droughts or the decrease/increase of wind energy production, for instance.
Researchers of the Earth System Services (ESS) group and research engineers of the Computational Earth Sciences (CES) group, both groups of the Earth Sciences Department at the Barcelona Supercomputing Center-Centro Nacional de Supercomputación (BSC-CNS), have addressed this barrier by developing a series of software packages that provides climate forecast information and climate indicators for sectorial applications. They are, on the one hand, the Climate Services Toolbox (a.k.a., CSTools) v4.0, and on the other hand, the so-called Climate Services Indicators (or, for short, CSIndicators). The group's expertise in sub-seasonal to decadal climate predictions and interactions with stakeholders from diverse socioeconomic sectors has allowed the researchers to develop state-of-the-art tools that bridge the gap between research and services.
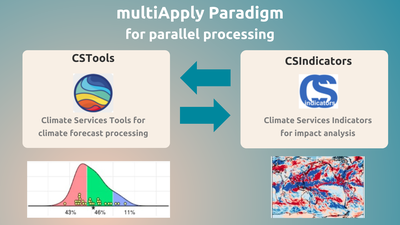
Credit: Núria Pérez-Zanón (BSC-CNS).
The CSTools is an easy-to-use toolbox designed and built to assess and improve the quality of climate forecasts for seasonal to multi-annual scales. The package, written in R language, contains process-based, state-of-the-art methods for forecast calibration, bias correction, statistical and stochastic downscaling, optimal forecast combination, multivariate verification, and primary and advanced tools to obtain tailored products. Due to the modular design of the toolbox in individual functions, the users can develop their post-processing chain of functions, including the analysis of relevant events, the generation of seasonal forecasts of snow depth, and the post-processing of temperature and precipitation data to be used as input in impact models.
On the other hand, the CSIndicators is an R package that gathers generalised methods for the flexible computation of climate-related indicators. Each method represents a specific mathematical approach combined with the possibility of selecting a flexible period to define the indicator. This enables a wide range of options for tailoring indicators to sectorial climate service applications. This package is intended for sub-seasonal, seasonal, and decadal climate predictions, but its methods also apply to other time scales. This package is also compatible with the CSTools R package, enabling a complete post-processing climate forecast (e.g., bias adjustment and downscaling). The vignettes attached to the software package are critical pieces of documentation to showcase the use of the package.
To our knowledge, CSIndicators is the first software intended to cover the earlier-mentioned gap between climate research and climate services under the premise of satisfying any sector requiring indicators based on sub-seasonal to decadal climate forecasts.
Both R packages profit from the multiApply R package for parallel processing. Furthermore, they are compatible with startR to take maximum advantage of a machine by chunking any analysis in pieces. The software packages have been made publicly available to the climate community through Open Access, and they can be found on CRAN (CSTools and CSIndicators) and the Earth Sciences Department GitLab repository (CSTools and CSIndicators). Although the use of the tools is free, the authors would appreciate citation of the respective publications and explicit acknowledgement of the work done.
Reference:
- CSTools: Pérez-Zanón, N., Caron, L.-P., Terzago, S., et al. (2022). Climate Services Toolbox (CSTools) v4.0: from climate forecasts to climate forecast information. Geoscientific Model Development, 15, 6115–6142. https://doi.org/10.5194/gmd-15-6115-2022.
- CSIndicators: Pérez-Zanón, N., Ho, A., Chou, C., et al. (2023). CSIndicators: Get tailored climate indicators for applications in your sector. Climate Services, volume 30, 100393. https://doi.org/10.1016/j.cliser.2023.100393.